Basic Image Operations
- Python Pillow - Working with Images
- Python Pillow - Resizing an Image
- Python Pillow - Flip and Rotate Images
- Python Pillow - Cropping an Image
- Python Pillow - Adding Borders to Images
- Python Pillow - Identifying Image Files
- Python Pillow - Merging Images
- Python Pillow - Cutting and Pasting Images
- Python Pillow - Rolling an Image
- Python Pillow - Writing text on image
- Python Pillow - ImageDraw Module
- Python Pillow - Concatenating two Images
- Python Pillow - Creating Thumbnails
- Python Pillow - Creating a Watermark
- Python Pillow - Image Sequences
Python Pillow Color Conversions
- Python Pillow - Colors on an Image
- Python Pillow - Creating Images With Colors
- Python Pillow - Converting Color String to RGB Color Values
- Python Pillow - Converting Color String to Grayscale Values
- Python Pillow - Change the Color by Changing the Pixel Values
Image Manipulation
- Python Pillow - Reducing Noise
- Python Pillow - Changing Image Modes
- Python Pillow - Compositing Images
- Python Pillow - Working with Alpha Channels
- Python Pillow - Applying Perspective Transforms
Image Filtering
- Python Pillow - Adding Filters to an Image
- Python Pillow - Convolution Filters
- Python Pillow - Blur an Image
- Python Pillow - Edge Detection
- Python Pillow - Embossing Images
- Python Pillow - Enhancing Edges
- Python Pillow - Unsharp Mask Filter
Image Enhancement and Correction
- Python Pillow - Enhancing Contrast
- Python Pillow - Enhancing Sharpness
- Python Pillow - Enhancing Color
- Python Pillow - Correcting Color Balance
- Python Pillow - Removing Noise
Image Analysis
Advanced Topics
- Python Pillow - Creating Animated GIFs
- Python Pillow - Batch Processing Images
- Python Pillow - Converting Image File Formats
- Python Pillow - Adding Padding to an Image
- Python Pillow - Color Inversion
- Python Pillow - M L with Numpy
- Python Pillow with Tkinter BitmapImage and PhotoImage objects
Python Pillow Useful Resources
- Python Pillow - Quick Guide
- Python Pillow - Function Reference
- Python Pillow - Useful Resources
- Python Pillow - Discussion
Python Pillow - Identifying Colors
In the context of image processing and analysis, identifying colors refers to the process of recognizing, categorizing, and extracting information about the different Colors on an Image. It involves the analysis of pixel data to determine the specific colors or color patterns within the image.
The Python Pillow library offers valuable tools for this purpose. This tutorial explores two fundamental functions, namely, getcolors() and getdata(), which play a crucial role in efficiently analyzing the color information present within images.
Identifying Colors with the getcolors() function
The getcolors() function returns a list of colors used within the image, with the colors represented in the image's mode. For example, in an RGB image, the function returns a tuple containing red, green, and blue color values. For a palette-based (P) image, it returns the index of the color in the palette. The syntax for using this function is −
Image.getcolors(maxcolors=256)
Where, maxcolors parameter is used to specify the maximum number of colors to retrieve. And it returns an unsorted list of tuples, each containing a count of occurrences and the corresponding color pixel value. If this maxcolors limit is exceeded, the method returns None (default limit: 256 colors).
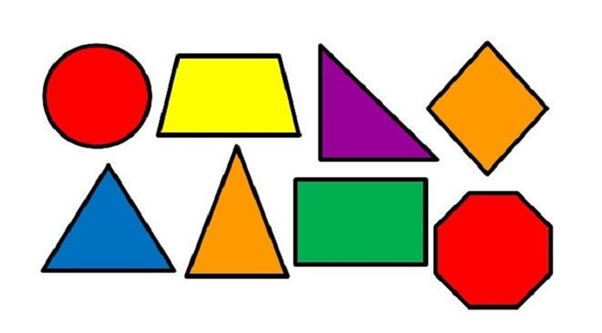
Example - Extracting Colors from an Image
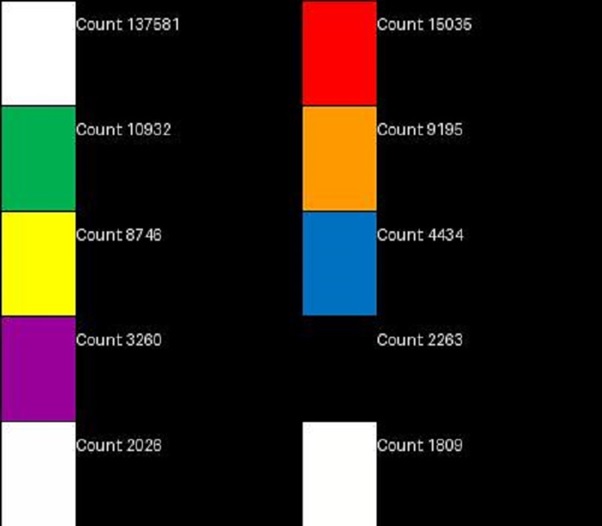
This example identifies the most frequent colors in an image using the Image.getcolors() function. It extracts the top 10 most common colors from the image and creates a color palette to visualize and display these colors along with their respective counts.
main.py
from PIL import Image, ImageDraw

# Open an image
input_image = Image.open('Images/colorful_shapes.jpg')

# Get the palette of the top 10 most common colors
palette = sorted(input_image.getcolors(maxcolors=100000), reverse=True)[:10]

cols = 2
rows = ((len(palette) - 1) // cols) + 1
cellHeight = 70
cellWidth = 200
imgHeight = cellHeight * rows
imgWidth = cellWidth * cols

result_image = Image.new("RGB", (imgWidth, imgHeight), (0, 0, 0))
draw = ImageDraw.Draw(result_image)

for idx, (count, color) in enumerate(palette):
   y0 = cellHeight * (idx // cols)
   y1 = y0 + cellHeight
   x0 = cellWidth * (idx % cols)
   x1 = x0 + (cellWidth // 4)

   draw.rectangle([x0, y0, x1, y1], fill=color, outline='black')
   draw.text((x1 + 1, y0 + 10), f"Count: {count}", fill='white')

# Display the input image
input_image.show('Input Image')

# Display the color chart
result_image.show('Output identified Colors')
Input Image
Output identified Colors
It is important to note that the getcolors() function returns None when the number of colors in the image is greater than the maxcolors argument. And it primarily works with 'RGB' images, which may not be ideal for all use cases.
For scenarios where you need more flexibility or when working with images of different color modes, using the Image.getdata() function in combination with other Python libraries can be a more convenient
Identifying Colors with the getdata() function
The getdata() function is another function within Pillow Image module that allows users to access the contents of an image as a sequence object containing pixel values. The sequence object is flattened, meaning values for each line follow directly after the values of the zero line, and so on. While the sequence object returned by this method is an internal Pillow data type, it can only support certain sequence operations, such as a Python list, for more convenient manipulation and printing. Here is the syntax of the function −
Image.getdata(band=None)
The parameters band is used to specify the band to return (default: all bands). To retrieve a single band, provide the index value (e.g., 0 to obtain the "R" band from an "RGB" image). And the function returns a sequence-like object that can be converted into more familiar data structures for further processing.
Example - Counting Colors of an Image
Here is an example that identifies the colors in an image and counts the occurrences of each color using the Image.getdata() function.
main.py
from PIL import Image
from collections import defaultdict

# Open an imagefrom PIL import Image
from collections import defaultdict

# Open an image
im = Image.open('Images/sea1.jpg')

# Create a defaultdict to store color counts
colors = defaultdict(int)

# Iterate through the image pixels and count each color
for pixel in im.getdata():
    colors[pixel] += 1

# Sort the colors by count in descending order
ordered_colors = sorted(colors.items(), key=lambda x: x[1], reverse=True)

# Print the top 10 colors and their counts
for color, count in ordered_colors[:10]:
    print(f"Color: {color}, Count: {count}")
from PIL import Image
from collections import defaultdict

# Open an image
im = Image.open('Images/sea1.jpg')

# Create a defaultdict to store color counts
colors = defaultdict(int)

# Iterate through the image pixels and count each color
for pixel in im.getdata():
    colors[pixel] += 1

# Sort the colors by count in descending order
ordered_colors = sorted(colors.items(), key=lambda x: x[1], reverse=True)
# Print the top 10 colors and their counts
for color, count in ordered_colors[:10]:
    print(f"Color: {color}, Count: {count}")

im = Image.open('Images/sea1.jpg')

# Create a defaultdict to store color counts
colors = defaultdict(int)

# Iterate through the image pixels and count each color
for pixel in im.getdata():
   colors[pixel] += 1

# Sort the colors by count in descending order
ordered_colors = sorted(colors.items(), key=lambda x: x[1], reverse=True)

# Print the top 10 colors and their counts
for color, count in ordered_colors[:10]:
   print(f"Color: {color}, Count: {count}")
Output
Color: (255, 255, 255), Count: 82
Color: (0, 33, 68), Count: 73
Color: (0, 74, 139), Count: 71
Color: (0, 78, 144), Count: 69
Color: (0, 77, 143), Count: 62
Color: (0, 63, 107), Count: 59
Color: (0, 34, 72), Count: 56
Color: (0, 36, 72), Count: 52
Color: (0, 30, 58), Count: 51
Color: (1, 26, 56), Count: 51
Example - Counting Most Frequent Color
The following example identifies the most frequent color in an image and counts the occurrences of the color using the Image.getdata() function together with Python collections library.
main.py
from PIL import Image
from collections import Counter

# Open an image
image = Image.open('Images/Road.jpg')

# Get a Counter dictionary of colors and their frequencies
colors = Counter(image.getdata())

# Get a set of unique colors
unique_colors = set(colors)

# Get the number of unique colors
num_unique_colors = len(unique_colors)

# Get the color with the highest frequency
most_frequent_color = max(colors, key=colors.get)

print(f"Unique Colors: {num_unique_colors}")
print(f"Most Frequent Color: {most_frequent_color} with a frequency of {colors[most_frequent_color]}")
Output
Unique Colors: 18323
Most Frequent Color: (26, 27, 31) with a frequency of 5598